Saturday, May 7, 2011

LaTeX for the NSF proposal-- bibtex do not apply!

Clearly, NSF must be trying to weed those of us out who are too faint of heart to figure out their obtuse LaTeX template.
 In particular, there is no \usepackage{hyperref}, which is the nice, kind bibliography I am used to from amstat.

Instead, we are faced with using the old fashioned package.
So without further ado, here's now to replicate the NSF bibliography style in LaTeX.

You would, of course, have more sources than this. But this is just to give you an idea of where you need to go.

\begin{thebibliography}{99}

\bibitem{paper01} Cathcart, J.F., J.D. Kline, M. Delauney, and M. Tilton {\em Carbon Storage and Oregon's Land Use Planning Program}, Journal of Forestry, 2007.\\
\bibitem{paper02} Smith, J., L.S. Heath, K.E. Skog, and R. Birdsey {\em Methods for calculating forest ecosystem and harvested carbon with standard estimates for forest tyoes of the United States}, Gen. Tech. Rep. NE-343. USDA Forest Service, Northeastern Research Station, Newton Square, PA, 2006.
\end{thebibliography}

Friday, April 29, 2011

The importance of typography

In early forestry publications in some journals, prior to today's typographical fireworks, articles could be confusing. This is because we use the term "log" to refer to... well... logs.

What does this mean to you?

"A relationship between the above-ground biomass and the diameter of trees has been demonstrated by Shinozaki et al. (1964),  Kira and Shidei (1967), Newbould (1967) and, in English Oaks, by Bunce (1968). A regression of the form log mass = 2.13 log diameter- 0.23 (r =0.96, p <0.01) was calculated...."


Hilton, G.M., J.R. Packham, and J. Willis. 1987. Effects of Experimental Defoliation on a Population of Pendulate Oak (Quercus rober L.). New Phytologist 107, 603-612.

If you didn't know that Pipe Model was an exponential scaling form (say, if you were a forester who isn't into ecological models),you might just think that mass was linearly related to diameter. Logically, this isn't correct, and you would soon figure out that your log did not have a mass of about 2 x its diameter, but it certainly could be confusing.

Sorry, that's not a tip or trick.

Later I'll have one for you. Probably related to .e00 files and geodatabases. I do think about those a lot.
For those who "social network" I have started Twitter for GeoTweeting. I want to catch my location as much as possible and see how I move. 


inspired by GIS

I really think the idea of VGI (volunteered geographic information) is just plain cool. I mean, as a bit of a data hound, there's really some fun in that-- and also in extracting the bias from it (no one is going to adamantly volunteer tweets such as'just buying a new toilet @ Lowes' or ' at the proctologist, @ hospital, what a pain in the butt!')

I made, for the sake of the geo-tweet, a Twitter for Lumber-geek. However, that name was already in use, so Lumber-geek's twitter is
http://twitter.com/#!/aSmallOne

The only posts I'll be making are geo-tweets and tech refernces. Don't expect updates on what I am doing outside of that. I'm too "emo" to be trusted with a non-directional twitter!

Thursday, April 28, 2011

GIS in the cloud

http://www.weather.com/outlook/weather-news/news/articles/tornado-outbreak-april-27_2011-04-27  

GIS in the cloud tells me of the damage to GA before I can find it on the news!

My family is OK, but some big torn-torns (recall the silly nickname i've had for these storms since I was a kid) hit right around Dekalb where my uncle Tom lives. Still I am lucky they are safe.

The real question, though, is "did the torn-torn that hit mountain city damage Goats on the Roof?"

I hope not.

Excel tip

I think I've spent most of my life doing things on Excel. In a way, if Matlab is an exciting night out on the town, Excel is an evening at home in bed with a blanket and a kids' movie.

I do love Excel 2010. SO much more than Excel 2007, which I did not love. And don't even get me going on Excel 2008. Mac users with no statistical analysis package? :(
I was sadly a Mac user at the time. Shhh... don't tell. I don't own any converse and I don't listen to much eclectic music.


Anyway. In Excel 2010 there is a header tab, the "data" tab. This tab is my best buddy on Excel due to the fact that it allows access to the "filter" feature (looks like a little conical funnel).  If you've not used filter I find it to be confusing at first due to needing to know where to click.

So to use filter, you want to highlight your first row. Which means you want to hold your cursor over the left side number (1) and right click on it-- in your spreadsheet, of course.


Now just press the funnel button to filter!


What you'll see if you press one of those down arrows is a list of all the values that is in that column. You can check on and off queries that you want to look at. For example, in the above, I might want to look at all events that happened in 1988. So I could turn my first column to 1988.

I find this to be a really useful tool for getting what I want from raw data. I know maybe to some people it seems obvious, but I thought I'd share, because you can't use tools if you don't know about them.

On a side note, I've been feeling a calling recently. I've noticed that for environmental science (forestry, geology, geography, hydro, etc.) research professionals (and just normal people who like science, there's really a dearth of good "intermediate level help." So what you end up with is a bunch of people with great questions and no tools to answer them. It's easy to google some question like, "how can I systematically delete every nth row in Matlab" and what you'll find is that there are easy help pages (it's Matlab! This is a program for computer processing. Let's write a script! "fprintf 'hello world'" > hello world!) and then there's really complicated (message board troll1 "just recompile your kernel using a batch processing script! write it in C#"! Come on!)

What there is a need for is a good source of intermediate help. I mean, hand-holding-style for the harder applications. It won't tell you "press 'new!' to open  the file" but it will say "and you can actually define interval in matlab by putting the interval between your coordinates. For example, 0:0.005:1 takes you from 0 to 1 with  an interval of 0.005. Now in a For Loop, that will look like this (screenshot).

I would love to partner with an Extension and gather up all the useful stuff I put on here, as well as other needs and tips I learn, and publish an official help column that would have a targeted audience....

Wednesday, April 27, 2011

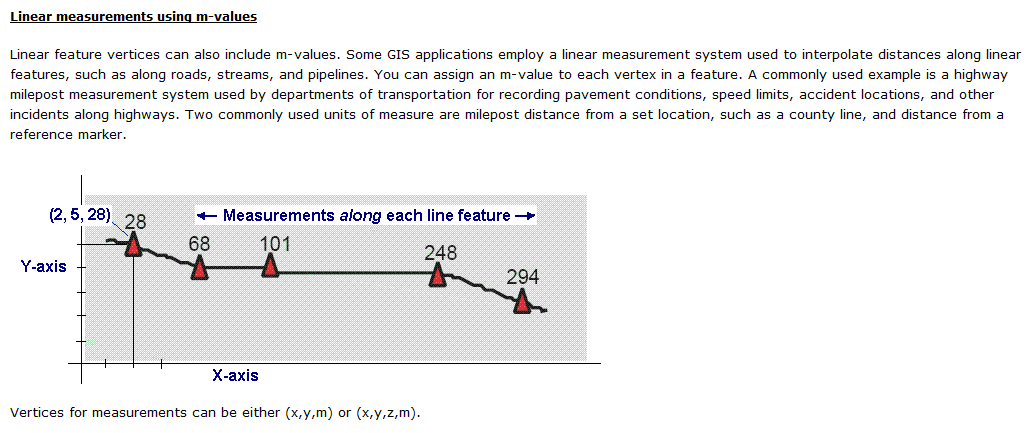
xyzm

http://webhelp.esri.com/arcgisdesktop/9.2/index.cfm?TopicName=feature_class_basics


ESRI's got a pretty clear explanation of xyzm construction.

To me it was a big discovery that elevation, like any other thing you might measure at a place, is an attribute of the location, and not part of the location itself. Did you know that if you mapped xy for every location in the world at a 1 km2 scale, you would need 10 Gb of computer space?-- that's right, two integers (well more if you are thinking in binary like the computer does) for all the world... 10 Gb!

Did you know that we only see something like 2 x 10-13 of the world with our own eyes and only live for 1.4 x 10⁻⁸ of its duration? Such I learned in class. That's an awfully small world. And yet we still get lost. 

Tuesday, April 26, 2011

For my own good...

Cloud Computing!

It's better than FTP. Biomass files (in order) 1980-2007

1980

1984

1988

1991

1995

2001

2007

These images are property of KRISTIN S. PETERSON. Re-prints must ask permission.