Let me share with you how this is done. For those who don't know, R is like MatLab in some ways, worse in some, better in others. One thing that I love about R is that it is open source, and as such usually there are many "packages" that people have designed that are easily available to you and integrated right into the program. All you have to do is go get them.
How is this done?
First, in R, go to the menu and choose Packages> "load package." if the package you want is already installed, you should see it under the load package menu
The factor analysis package is not one of those packages on my computer (or it wasn't at first-- sometimes it will show up on that menu if you have loaded it before.) So instead you need to set your CRAN mirror. Technically that means that you need to go to Packages > Install Packages> and when a little menu comes up select the location closest to you. As a little secret, I always forget whether or not CA1 or CA2 is Berkeley (the other is UCLA). never have I selected the right one.
okay! now, the package you want is called FactoMineR
if you can't find it, scroll around a bit-- sometimes how these things are ordered is confusing because there are CAPS in random places (because that's all the cOoLz now, or so I've heard).
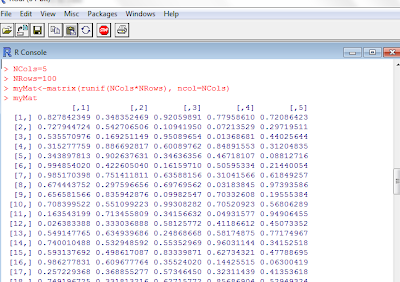
Now, you will need a data matrix. I don't have a good one on hand, so I'm going to make a random one
so you see, I told it to make the number of columns as "6" (Ncol = 6), the number of rows as 100 (Nrow=100), then I named my matrix "myMat" and ran it for the size of Ncol* Nrow where the number of columns is Ncol.
Now I want to load up that package we just installed. Take a look back at picture 1 if you are confused, but go to Packages > Load Package, and you should see "FactoMineR" on there. Just click it and you'll see some stuff in the command prompt.
Okay, you got this.
Now, just tell it
result = PCA(myMat)
and you will get this:
Because myMat was drawn from a random distribution, there aren't any correlations amongst my vectors. Nonetheless, this is a neat tool, and that graph on the left was apparently pretty cool to people at AGU. I hope you can use this tip for your own presentations for easy and fun PCA!


No comments:
Post a Comment