Everyone should know these, because they make 3D plots much easier to read.
Axes on
Grid on
Axes on...as you may have guessed...turns on the axes.
Grid on... turns on a grid. You can specify interval.
So for example, you can say
Figure(1)
plot3(data1,data2,data3, 'k.')
axes on
grid on
the 'k.' will make your plot default to black dots. If you type "help plot" in command window you can see all kinds of various combining strategies for this input.I like to think of it as Matlab's much simpler correlate to the "pch =" command from R.
Monday, April 25, 2011

Saturday, April 23, 2011
NSF demo site
Hello-- not much to post tonight. We just watched Sebastian Seung's I am my Connectome on TED.
My husband is looking for post-doc stuff, so tonight I was sharing with him a neat resource I learned about in class. This is the NSF fastlane DEMO site.
If you navigate to fastlane you'll see the demo site on the left side. It's fairly self-explanatory to get into, just make sure you log in as "Terry Demo" (that's your "name") and keep Terry's password.


As a bonus I will also say this, my boss finally got to share with me some proposals written by her students in the past and by her and others in our working group. She also helpfully told me which were funded and which were not.
I think it's really great to read proposals, funded and not, and if you can get it, the reviews on them. I'm learning a few things like
1. you better have damn good, disproveable hypotheses.
2. you should probably start with an outline and build in info around it
3. your research doesn't need to change the world. but it does need to change someone's world (broader impacts are pretty important!)
so clearly I'm no master of this yet, but that's the trend I'm noticing so far, and if I'm wrong I've got the rest of my life to find out and refine my hypotheses... about hypotheses...
wow.
I've heard asking good questions is the hardest part of this. I've certainly got plenty of questions! Now just to make them good.
Wednesday, April 20, 2011
rick-roll mom-

The link-response, works every time.Not for the sophisticated of humor below, but this film scene has completely ruined the line "works every time" for me-- it's not dirty just silly!
SIX THINGS YOU MUST PUT ON A MAP!
1. A title, which is CONCISE and is in all CAPS and tells your story, like"TRAILS OF CORVALLIS OR" or "COFFEE SHOPS IN SAN FRANCISCO"
2. Source from which the data was taken (GEO 580 WEBPAGE-- doesn't have to be caps)
3. Cartographer's name (YOU!)
3. Cartographer's name (YOU!)
4. Date the map was created
5. SCALE BAR!!!! NOTE YOU MUST LOAD IT IN THE RIGHT PROJECTION. Do not be afraid to import a projection if you are loading onto a dataframe with pesky polygons who will mess you up,
6. North arrow-- not everyone knows that the south-facing slope receives the greatest insolation in the northern hemisphere, so don't just let 'em guess.
Sunday, April 17, 2011
Rick-Roll Oregon, and also... Arc GIS
Yes, Oregon is in the news. This is kind of week old news, but whatever.
So..here's a fun thing. What if you want to do a pretty complicated operation in ArcMap mathematically. Perhaps something that would be pretty annoying to do using Raster Calculator (which is annoying itself when the syntax of the map is strange). Well, why not just export the file as an XY table and mess with your Z and then re-import it.
How do I do this is 9.3.1? Well first, you want to find your raster you want to work with and you are going to use the Conversion tools to go from Raster to point.
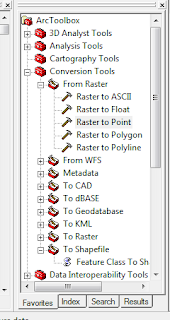


So..here's a fun thing. What if you want to do a pretty complicated operation in ArcMap mathematically. Perhaps something that would be pretty annoying to do using Raster Calculator (which is annoying itself when the syntax of the map is strange). Well, why not just export the file as an XY table and mess with your Z and then re-import it.
How do I do this is 9.3.1? Well first, you want to find your raster you want to work with and you are going to use the Conversion tools to go from Raster to point.
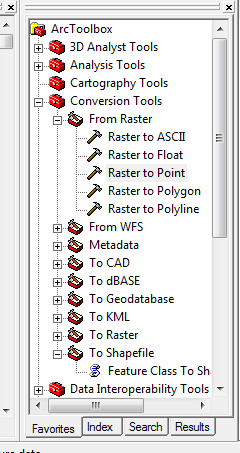
Now you should generate a shapefile using this that has the value you want from your raster (NOTE THAT YOU CHOOSE THE VALUE YOU WANT IF YOU HAVE MULTIPLE INFORMATION IN YOUR RASTER!!) stored as a point. In a sense, you've just gone from the field data model to a set of regularly distributed object data models (features in this case who are part of a geo-relational shape file).
Look at me using those big ArcWords from school. Would you like some ArcFries with that?

Right. now in your tool box you need to go to Data Management tools, features, Add XY coordinates. If DM tools won't open up on the menu go tools> extensions and make sure you have it enabled.

What a great tool! One input!

And there's your output, which under options you can export as a table or Database file. Manipulate as you see fit, and then you will add it back to your map later! Which I will also discuss...later!
Saturday, April 16, 2011
Relative sources with ArcGIS

For a while, I thought Arc was tied to absolute sources. Move your file on your HD, lose your connection, and you've got to rebuild your map all over again.
Not so!
Under "FILE" in ArcMAP there is an option called "Document properties"
Click there and then click on data source options and switch the button to the second option, show relative path to the data source.
Phew.
Now you can reorganize without losing your maps!
Thursday, April 14, 2011
Manuscript p. 3

I knew it was in press a bit back but I'm so glad to have a visual on it.
Target acquired!
So remember folks, ~ 1 year from paper to press.
Important!
"Sharp eyes"

I just have to wonder if sharp eyes should really be "a really good image processing algorithm"
Astronomers out there, is this a task that is done by hand? Or is it automated? I certainly wouldn't think bad of it! Seems like that would actually be a neat little relational model to write!
Subscribe to:
Posts (Atom)