Friday, April 29, 2011

The importance of typography

In early forestry publications in some journals, prior to today's typographical fireworks, articles could be confusing. This is because we use the term "log" to refer to... well... logs.

What does this mean to you?

"A relationship between the above-ground biomass and the diameter of trees has been demonstrated by Shinozaki et al. (1964),  Kira and Shidei (1967), Newbould (1967) and, in English Oaks, by Bunce (1968). A regression of the form log mass = 2.13 log diameter- 0.23 (r =0.96, p <0.01) was calculated...."


Hilton, G.M., J.R. Packham, and J. Willis. 1987. Effects of Experimental Defoliation on a Population of Pendulate Oak (Quercus rober L.). New Phytologist 107, 603-612.

If you didn't know that Pipe Model was an exponential scaling form (say, if you were a forester who isn't into ecological models),you might just think that mass was linearly related to diameter. Logically, this isn't correct, and you would soon figure out that your log did not have a mass of about 2 x its diameter, but it certainly could be confusing.

Sorry, that's not a tip or trick.

Later I'll have one for you. Probably related to .e00 files and geodatabases. I do think about those a lot.
For those who "social network" I have started Twitter for GeoTweeting. I want to catch my location as much as possible and see how I move. 


inspired by GIS

I really think the idea of VGI (volunteered geographic information) is just plain cool. I mean, as a bit of a data hound, there's really some fun in that-- and also in extracting the bias from it (no one is going to adamantly volunteer tweets such as'just buying a new toilet @ Lowes' or ' at the proctologist, @ hospital, what a pain in the butt!')

I made, for the sake of the geo-tweet, a Twitter for Lumber-geek. However, that name was already in use, so Lumber-geek's twitter is
http://twitter.com/#!/aSmallOne

The only posts I'll be making are geo-tweets and tech refernces. Don't expect updates on what I am doing outside of that. I'm too "emo" to be trusted with a non-directional twitter!

Thursday, April 28, 2011

GIS in the cloud

http://www.weather.com/outlook/weather-news/news/articles/tornado-outbreak-april-27_2011-04-27  

GIS in the cloud tells me of the damage to GA before I can find it on the news!

My family is OK, but some big torn-torns (recall the silly nickname i've had for these storms since I was a kid) hit right around Dekalb where my uncle Tom lives. Still I am lucky they are safe.

The real question, though, is "did the torn-torn that hit mountain city damage Goats on the Roof?"

I hope not.

Excel tip

I think I've spent most of my life doing things on Excel. In a way, if Matlab is an exciting night out on the town, Excel is an evening at home in bed with a blanket and a kids' movie.

I do love Excel 2010. SO much more than Excel 2007, which I did not love. And don't even get me going on Excel 2008. Mac users with no statistical analysis package? :(
I was sadly a Mac user at the time. Shhh... don't tell. I don't own any converse and I don't listen to much eclectic music.


Anyway. In Excel 2010 there is a header tab, the "data" tab. This tab is my best buddy on Excel due to the fact that it allows access to the "filter" feature (looks like a little conical funnel).  If you've not used filter I find it to be confusing at first due to needing to know where to click.

So to use filter, you want to highlight your first row. Which means you want to hold your cursor over the left side number (1) and right click on it-- in your spreadsheet, of course.


Now just press the funnel button to filter!


What you'll see if you press one of those down arrows is a list of all the values that is in that column. You can check on and off queries that you want to look at. For example, in the above, I might want to look at all events that happened in 1988. So I could turn my first column to 1988.

I find this to be a really useful tool for getting what I want from raw data. I know maybe to some people it seems obvious, but I thought I'd share, because you can't use tools if you don't know about them.

On a side note, I've been feeling a calling recently. I've noticed that for environmental science (forestry, geology, geography, hydro, etc.) research professionals (and just normal people who like science, there's really a dearth of good "intermediate level help." So what you end up with is a bunch of people with great questions and no tools to answer them. It's easy to google some question like, "how can I systematically delete every nth row in Matlab" and what you'll find is that there are easy help pages (it's Matlab! This is a program for computer processing. Let's write a script! "fprintf 'hello world'" > hello world!) and then there's really complicated (message board troll1 "just recompile your kernel using a batch processing script! write it in C#"! Come on!)

What there is a need for is a good source of intermediate help. I mean, hand-holding-style for the harder applications. It won't tell you "press 'new!' to open  the file" but it will say "and you can actually define interval in matlab by putting the interval between your coordinates. For example, 0:0.005:1 takes you from 0 to 1 with  an interval of 0.005. Now in a For Loop, that will look like this (screenshot).

I would love to partner with an Extension and gather up all the useful stuff I put on here, as well as other needs and tips I learn, and publish an official help column that would have a targeted audience....

Wednesday, April 27, 2011

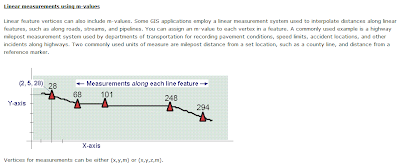
xyzm

http://webhelp.esri.com/arcgisdesktop/9.2/index.cfm?TopicName=feature_class_basics


ESRI's got a pretty clear explanation of xyzm construction.

To me it was a big discovery that elevation, like any other thing you might measure at a place, is an attribute of the location, and not part of the location itself. Did you know that if you mapped xy for every location in the world at a 1 km2 scale, you would need 10 Gb of computer space?-- that's right, two integers (well more if you are thinking in binary like the computer does) for all the world... 10 Gb!

Did you know that we only see something like 2 x 10-13 of the world with our own eyes and only live for 1.4 x 10⁻⁸ of its duration? Such I learned in class. That's an awfully small world. And yet we still get lost. 

Tuesday, April 26, 2011

For my own good...

Cloud Computing!

It's better than FTP. Biomass files (in order) 1980-2007

1980

1984

1988

1991

1995

2001

2007

These images are property of KRISTIN S. PETERSON. Re-prints must ask permission. 

Monday, April 25, 2011

Four simple MatLab words

Everyone should know these, because they make 3D plots much easier to read.

Axes on
Grid on

Axes on...as you may have guessed...turns on the axes.
Grid on... turns on a grid. You can specify interval.

So for example, you can say

Figure(1)
plot3(data1,data2,data3, 'k.')
axes on
grid on

the 'k.' will make your plot default to black dots. If you type "help plot" in command window you can see all kinds of various combining strategies for this input.I like to think of it as Matlab's much simpler correlate to the "pch =" command from R.

Saturday, April 23, 2011

NSF demo site

Hello-- not much to post tonight. We just watched Sebastian Seung's I am my Connectome on TED. 

My husband is looking for post-doc stuff, so tonight I was sharing with him a neat resource I learned about in class. This is the NSF fastlane DEMO site. 
If you navigate to fastlane  you'll see the demo site on the left side. It's fairly self-explanatory to get into, just make sure you log in as "Terry Demo" (that's your "name") and keep Terry's password.


 You can go into there and find all kinds of practice proposal areas-- you want to probably use the Proposal Functions

I'll admit I haven't fully explored it yet, but I'm working on it now, and I think its a neat, safe way to see the inner workings of the Fastlane without the major "Oh crud!" factor that is associated with actually submitting things incorrectly.

As a bonus I will also say this, my boss finally got to share with me some proposals written by her students in the past and by her and others in our working group. She also helpfully told me which were funded and which were not.
I think it's really great to read proposals, funded and not, and if you can get it, the reviews on them. I'm learning a few things like

1. you better have damn good, disproveable hypotheses.
2.  you should probably start with an outline and build in info around it
3. your research doesn't need to change the world. but it does need to change someone's world (broader impacts are pretty important!)

so clearly I'm no master of this yet, but that's the trend I'm noticing so far, and if I'm wrong I've got the rest of my life to find out and refine my hypotheses... about hypotheses...
wow.
I've heard asking good questions is the hardest part of this. I've certainly got plenty of questions! Now just to make them good.

Wednesday, April 20, 2011

rick-roll mom-


First, the above shows a convenient method for rick-rolling your mom

The link-response, works every time.Not for the sophisticated of humor below, but this film scene has completely ruined the line "works every time" for me-- it's not dirty just silly!

SIX THINGS YOU MUST PUT ON A MAP!

1. A title, which is CONCISE and is in all CAPS and tells your story, like"TRAILS OF CORVALLIS OR" or "COFFEE SHOPS IN SAN FRANCISCO"
2. Source from which the data was taken (GEO 580 WEBPAGE-- doesn't have to be caps)
3. Cartographer's name (YOU!)
4. Date the map was created
5. SCALE BAR!!!! NOTE YOU MUST LOAD IT IN THE RIGHT PROJECTION. Do not be afraid to import a projection if you are loading onto a dataframe with pesky polygons who will mess you up,
6. North arrow--  not everyone knows that the south-facing slope receives the greatest insolation in the northern hemisphere, so don't just let 'em guess.


Sunday, April 17, 2011

Rick-Roll Oregon, and also... Arc GIS

Yes, Oregon is in the news. This is kind of week old news, but whatever.

So..here's a fun thing. What if you want to do a pretty complicated operation in ArcMap mathematically. Perhaps something that would be pretty annoying to do using Raster Calculator (which is annoying itself when the syntax of the map is strange). Well, why not just export the file as an XY table and mess with your Z and then re-import it.

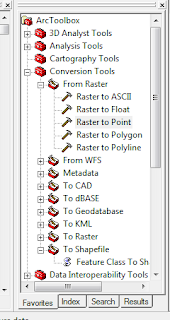
How do I do this is 9.3.1? Well first, you want to find your raster you want to work with and you are going to use the Conversion tools to go from Raster to point.

Now you should generate a shapefile using this that has the value you want from your raster (NOTE THAT YOU  CHOOSE THE VALUE YOU WANT IF YOU HAVE MULTIPLE INFORMATION IN YOUR RASTER!!) stored as a point. In a sense, you've just gone from the field data model to a set of regularly distributed object data models (features in this case who are part of a geo-relational shape file).
Look at me using those big ArcWords from school. Would you like some ArcFries with that?
Right. now in your tool box you need to go to Data Management tools, features, Add XY coordinates. If DM tools won't open up on the menu go tools> extensions and make sure you have it enabled.


What a great tool! One input!

And there's your output, which under options you can export as a table or Database file. Manipulate as you see fit, and then you will add it back to your map later! Which I will also discuss...later!

Saturday, April 16, 2011

Relative sources with ArcGIS

One year with Arc and someone (professor) finally reveals a secret that I wish I had known in the past.

For a while, I thought Arc was tied to absolute sources. Move your file on your HD, lose your connection, and you've got to rebuild your map all over again.
Not so!
Under "FILE" in ArcMAP there is an option called "Document properties"
Click there and then click on data source options and switch the button to the second option, show relative path to the data source.
Phew.
Now you can reorganize without losing your maps!

Thursday, April 14, 2011

Manuscript p. 3

Aha! The ACCEPT logo has finally emerged!
I knew it was in press a bit back but I'm so glad to have a visual on it.
Target acquired!

So remember folks, ~ 1 year from paper to press.
Important!

"Sharp eyes"


I just have to wonder if sharp eyes should really be "a really good image processing algorithm"
Astronomers out there, is this a task that is done by hand? Or is it automated? I certainly wouldn't think bad of it! Seems like that would actually be a neat little relational model to write!